Creating a global dynamic map of cultivable land: harnessing LULC applications in agriculture
Arable land, vital for agriculture, feeds us all. While creating a mere 2.5 centimeters of topsoil necessitates 500 years of uninterrupted ecological processes, the alarming reality is that over the past four decades, one-third of arable land was lost to erosion and pollution.
- Recycling : Utilizing unused land productively,
- Rejuvenating: Improving the health and fertility of degraded land
- Regenerating: Restoring the land for the future.
LULC maps empower us in combating indiscriminate land use practices, such as deforestation for agriculture, and promoting transparency and accountability in land management. Additionally, they play a pivotal role in identifying policies that incentivize responsible land utilization while imposing penalties for its misuse.
What is LULC?
Why is LULC important?
LULC maps are invaluable tools for numerous applications, such as:
In Agriculture
- Natural resource management : Optimizing water, agricultural, and forest resources for sustainable use.
- Food security: Identifying optimal land for specific crops and potential agricultural expansion areas, and assessing the impact of climate change on agricultural productivity at regional and global levels.
- Environmental protection: Tracking deforestation, soil erosion, urban sprawl, agricultural expansion’s impact on ecosystems & resources.
- Baseline mapping for GIS input:LULC maps are the foundation for enabling informed decision-making across various fields using GIS analysis.
Some non-agricultural areas where LULC finds application are
- Urban expansion/encroachment
- Wildlife habitat protection
- Routing and logistics planning
- Disaster risk reduction
- Legal boundaries for property and tax evaluation
- Target detection
- Understanding impact of climate change
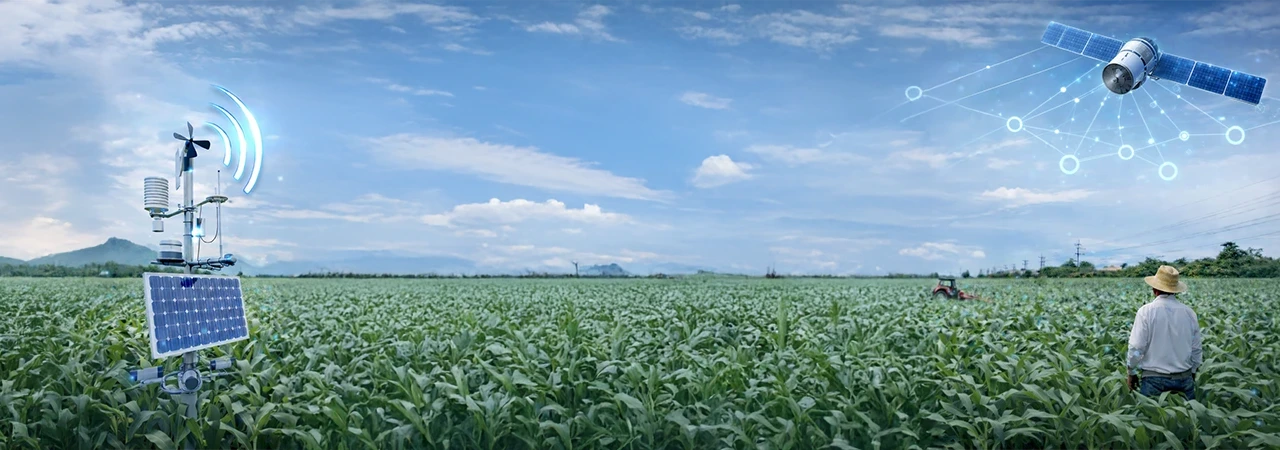
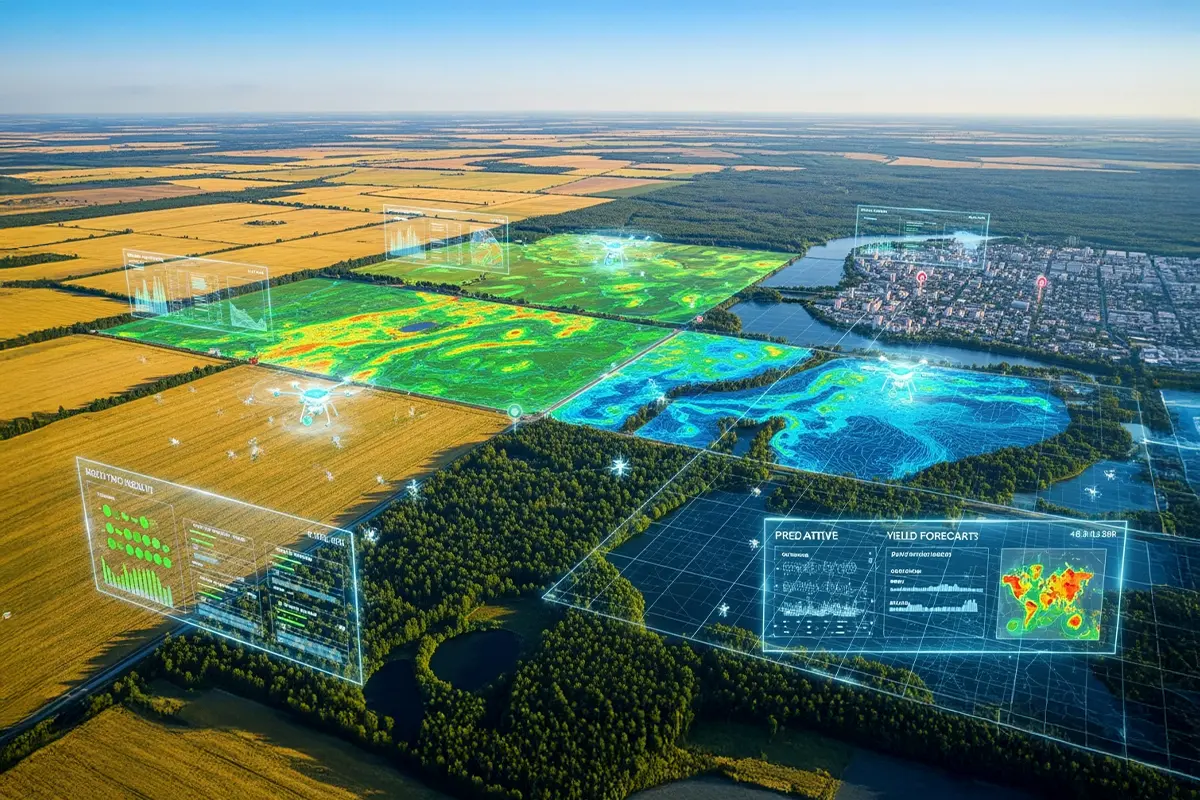
Unveiling the land: technologies behind LULC maps
- Remote sensing : Remote Sensing data sources like satellites are the most practical and cost-efficient and offer satellite images with spatial resolution (pixel size) varying from centimeter to kilometer. Satellite images of Earth’s surface, provide useful data on land cover, built-up land, cultivated area, water bodies, etc. Choice of the ideal satellite image for land use and land cover (LULC) mapping is determined by what the user needs. Images with moderate resolution are required to map a large area like a whole region. And for detailed mapping, images with higher resolution for a closer look are necessary.
- Geographic Information Systems (GIS): GIS is a powerful tool that integrates data from different sources, and timelines. The multi-temporal data and synoptic pictures provided by remote sensing are converted into meaningful LULC maps by GIS software. The tool lets users validate and edit data, and allows structure and geometric conversion to analyze and visualize spatial information. It also offers a user-friendly environment to manage, store, and retrieve spatial information.
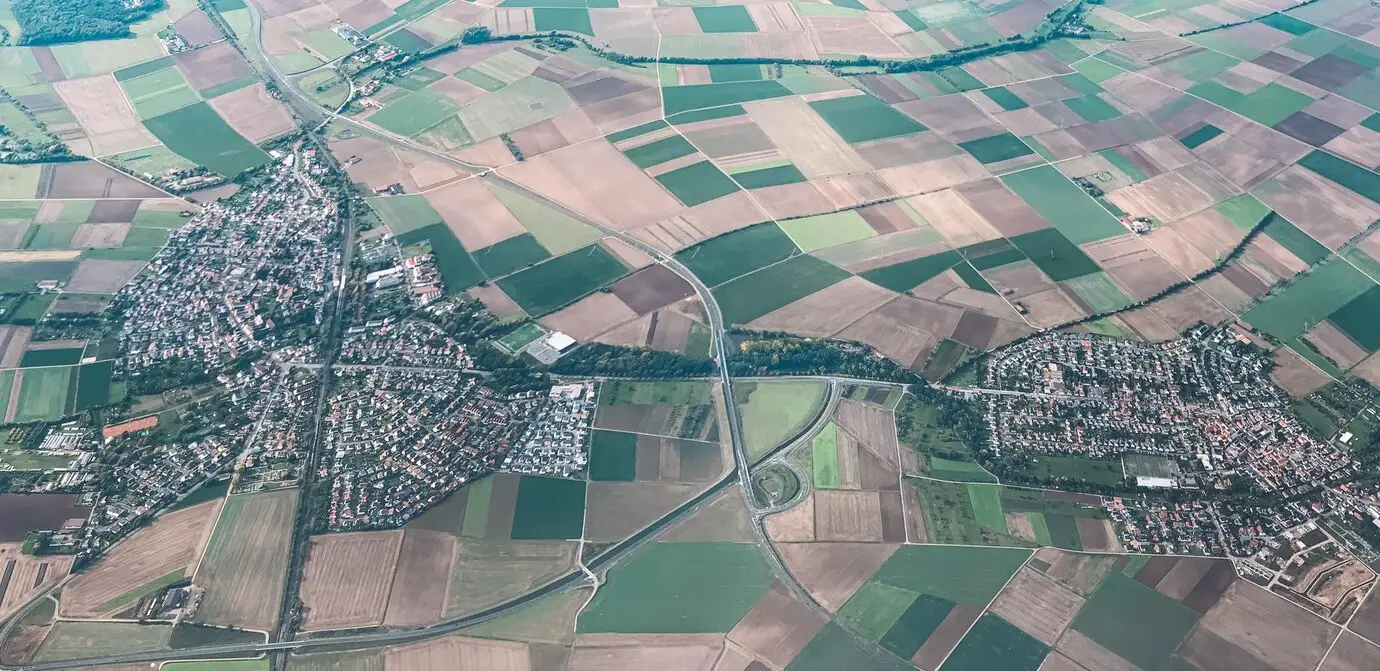
Understanding the landscape: LULC classifications
Natural land cover:
- Forest : Dense tree cover with significant ecological functions.
- Grassland: Open areas dominated by grasses, supporting grazing and biodiversity.
- Wetlands: Areas with waterlogged soils, crucial for water storage and filtration.
- Barren land: Areas with sparse vegetation, often due to natural factors like rocky terrain or deserts.
Artificial land cover:
- Urban: Areas dominated by buildings, transportation infrastructure, and other human-made structures.
- Cropland: Land used for agricultural production, including fields, orchards, and vineyards.
- Rangeland: Extensive areas for grazing livestock, often with scattered vegetation.
Water bodies:
- Oceans and seas: Extensive saltwater bodies covering most of Earth’s surface.
- Lakes and rivers: Inland freshwater bodies supporting various ecosystems and human uses.
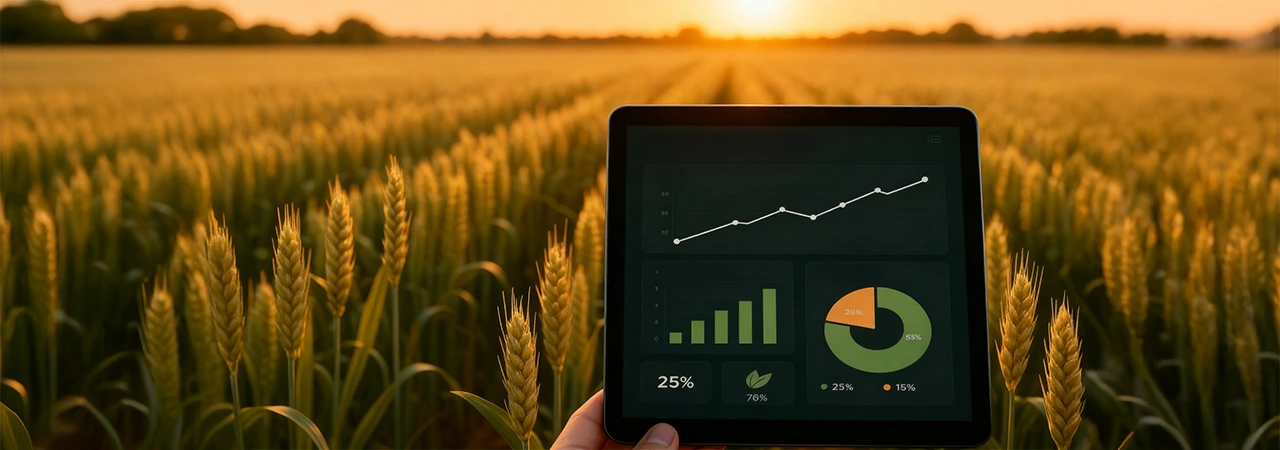
LULC: a guiding light for agriculture
Benefits of data-driven insights from LULC – the land’s resume, empowering informed expansion!
- Go green, grow strong: Protect your land and your reputation. LULC guides sustainable practices and minimizes environmental impact.
- Mitigate deforestation:LULC maps are critical tools for detecting and quantifying deforestation, enabling timely interventions and conservation efforts.
- Optimize crop selection: Find the perfect match! LULC data reveals ideal soil, water, and climate for optimal yield.
- A risk management masterclass: LULC identifies potential threats like flooding and erosion securing your operations.
Use of LULC maps to mitigate deforestation
- Early detection, swift action: LULC maps, updated regularly using satellite imagery, reveal deforestation even in remote areas. Changes in forest cover become evident, allowing authorities to investigate potential illegal activities and enforce regulations before significant damage occurs.
- Quantifying the loss, informing solutions: By comparing historical and current LULC maps, we can measure the precise area of forest lost, providing valuable data for policymakers and conservationists. Identification of the rate and spatial patterns of deforestation helps to pinpoint hotspots. This data can be used to prioritize areas for protection or restoration.
- Guiding conservation efforts: LULC maps help detect areas with high conservation value, such as old-growth forests or critical wildlife corridors. Using this information, effective conservation strategies can be designed, and the efficiency of resource allocation can be enhanced.
- Beyond detection:LULC maps reveal deforestation and offer insights into its underlying causes. LULC maps act as an investigative tool to detect hidden drivers behind deforestation, by analyzing land-use changes such as agricultural expansion, infrastructure development, or unsustainable logging practices, surrounding deforested regions. This deeper understanding enables targeted solutions to tackle the root causative factor, unlocking sustainable solutions for our vanishing forests.
So, before you get swept away by the promise of new horizons, let LULC be your compass. Learn all about the specific land in question.
- What is the vegetation: Learn if the vegetation in the area of interest is classified under forest land, cropland, barren land or the land falls under urban land or water bodies.
- Details of water bodies: Lakes, rivers, ponds, and even irrigation channels.
- Specifics of built-up areas: Farmhouses, barns, storage facilities, and the like.
- Bare land: Think exposed soil, waiting for its next agricultural conversion.
- Deforestation devil: Learn if the lush land is part of a deforestation nightmare.
Finally, understand what can be cultivated.
A tale of two expansions: with and without LULC
Scenario 1: without LULC models
- Miss crucial information: Hidden variations in land, water availability, or microclimates due to changes in terrain or vegetation might be missed.
- Leads to costly mistakes:Planting crops in unsuitable areas could result in poor yields, wasted resources, and financial losses.
- Limit long-term planning:Predicting future land suitability for specific crops becomes difficult without understanding how land use and cover might change.
Scenario 2: with LULC models
- Identify optimal locations : The model helps pinpoint areas with ideal characteristics, water availability, to maximize yield potential.
- Reduce risks: By mapping areas prone to floods, droughts, or pests, the enterprise can avoid expansions in risky locations, saving resources and preventing losses.
- Support sustainable practices : LULC models can help identify areas for conservation or reforestation, promoting ecosystem health and long-term land productivity.
Monitoring deforestation
The EU Deforestation Regulation (EUDR) demands the use of such robust digital tools to monitor, report and control forest loss. Beyond EUDR, various global regulations are in the pipeline to protect our dwindling forests. LULC maps with their ability to identify deforestation hotspots and quantify losses, will serve as data-driven allies.