


Synopsis: This blog explores a range of vegetation indices obtained from satellite imagery. It elaborates on how these data sets can be fed onto Artificial Intelligence (AI) and Machine Learning (ML) models to derive agri-intelligence for precision agriculture. It highlights how modern agriculture uses vegetation indices to enhance productivity, predictability, and sustainability.
Almost all aspects of our lives — breathing, clothing, shelter, food, etc. — are deeply intertwined with vegetation. Any change in the vegetation structure drastically impacts the environment and economy. In recent times, the advancement of GIS, GPS, remote sensing, and precision agriculture have significantly improved crop management. With detailed analysis and effective management of temporal and spatial variability within fields, precision agriculture ensures optimized input resource usage and improved crop performance.
No discussion on precision agriculture can be complete without addressing the Vegetation Index, especially in the context of remote sensing. Continue reading to learn about these vegetation indices and their significance in precision agriculture.
What is a Vegetation Index (VI)?
A Vegetation Index assists in periodic remote observations of vegetation and has been actively used since 1974. Vegetation indices (VIs) are mathematical expressions that transform spectral imaging data to highlight vegetation properties.
Using this algorithm, scientists and other concerned personnel effectively observe photo-centric activities, identify variations in the canopy, and draw accurate comparisons if needed. It includes assessing various aspects, like crop growth, vigor, biomass, and chlorophyll content.
How are vegetation indices measured from Space?
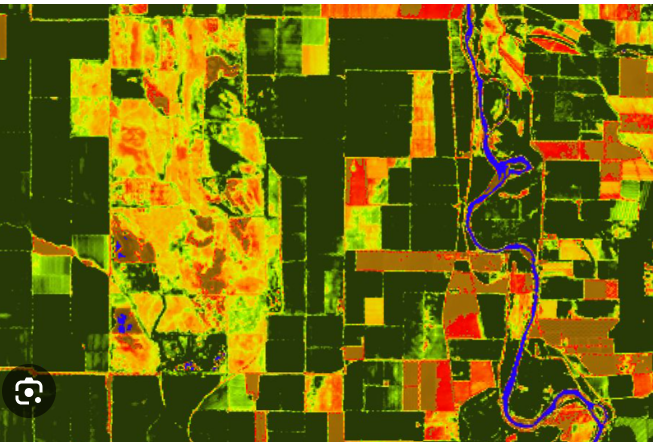
The vegetation index has evolved rapidly in the last twenty years, and now, Agtech pioneers like Cropin are dynamically leveraging it in remote cultivation monitoring. It helps determine vital information like positives and stresses on a farm.
These readings are spatial and taken from whatever is visible from space or the near-infrared light reflections from the surface to space. Optical satellite sensors are used to measure solar radiation. To take readings on different bands, multi-spectral optical sensors are used. Each channel in this band is designed so that it is sensitive to a very narrow range of wavelengths color-coded as:
- Blue (450 nm-510 nm)
- Green (510 nm-580 nm)
- Red (630 nm-690 nm)
- Near-infrared (NIR) (770 nm-895 nm)
- Short wave infrared (SWIR) (1100 nm-3000 nm)
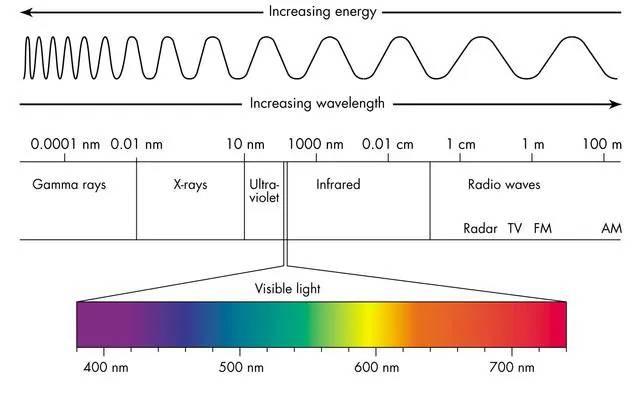
Blue and red bands reflect a vegetation index of lower value, and as the value increases, it turns green. On the other hand, those of higher values are read by the near-infrared band. Most indices used in agriculture typically leverage data from the red and near-infrared (NIR) regions of the electromagnetic spectrum. They employ ratio-based formulas to distinguish between vegetated areas and bare soil while accounting for varying illumination conditions. Their effectiveness stems from the inverse relationship between red and NIR reflectance, particularly in healthy green vegetation.
Several satellites provide vegetation indices data. The most common ones include Advanced Very High-Resolution Radiometer (AVHRR), Moderate-resolution Imaging Spectroradiometer (MODIS) Vegetation 1 and 2 sensors, Landsat series, Sentinel-2, WorldView, Planet. The best choice will depend on your specific needs. Some factors to consider are:
- Resolution: How much detail do you need?
- Coverage area: How large is the area of interest?
- Temporal resolution: How often do you need data updates?
- Cost: Is free data sufficient, or will you pay for higher resolution options?
Classification of vegetation indices
Vegetation indices have been classified based on several criteria, like –
- Number of spectral bands involved (two or more)
- Calculation method (ratio-based or orthogonal)
- Evolutionary lineage (categorized as first or second-generation)
Using these classifications, one can select vegetation indices suitable to their objectives and analytical requirements.
The Application of the Vegetation Index in Agriculture
Agtech revolutionaries use the vegetation index actively in precision agriculture and optimize input usage while maximizing per-acre yield. Listed below are some uses of vegetation indices in agriculture:
- Precision Agriculture
- Classify vegetation
- Crop management
- Estimate the water content of soil remotely
- Schedule & manage crop irrigation
- Monitor evaporation and plant transpiration
- Detection and quantification of crop diseases
- Assess tillage
- Identify changes in biodiversity
- Future reference to mark periodic changes over time
Benefits of vegetation indices
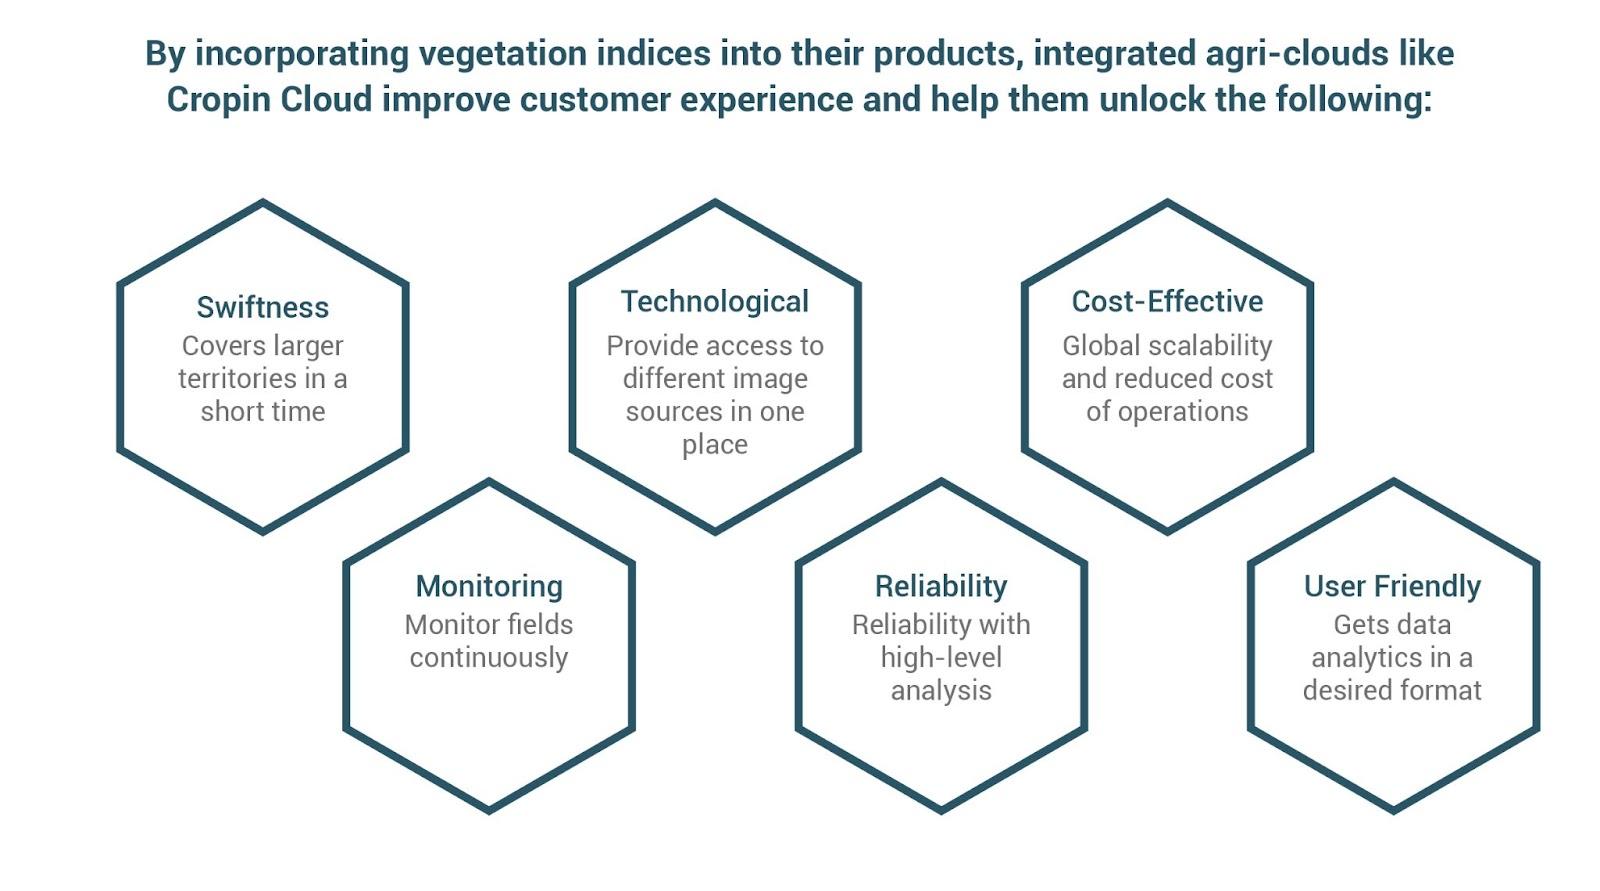
Vegetation indices are vital in crop growth analytics, empowering sustainable and responsible food production. By incorporating vegetation indices into their products, integrated agri-cloud platforms like Cropin Cloud improve customer experience and help them unlock the following benefits:
- Remote intelligence: Provides valuable intelligence into Crop health.
- Data precision: Ensures accurate and reliable measurements of the status of your farmlands; gets data analytics in a preferred format
- Cost efficiency: It is more cost-effective as it reduces the need for physical field inspections.
- Miles-away control: Allows companies to monitor and manage farm operations remotely without disturbing field activities.
- Enable scale: It allows monitoring of large-scale field activities in a short time and can also be scaled quickly and efficiently.
- Constant Monitoring: Monitor fields continuously and provide access to different image sources in one place.
Examples of Vegetation Indices and how to calculate them
Ensuring your crops are well-irrigated and the soil has proper nutrients alone are insufficient to maximize productivity. It requires a 360-degree view of every factor that influences your yield. Vegetation indices derived via remote sensing data provide the necessary high-level analysis of the crop state. For this, scientists use effective remote-sensing techniques to monitor Green cover percentage, Leaf area index, Green biomass, Chlorophyll content, Absorbed photosynthetically active radiation (APAR), etc.
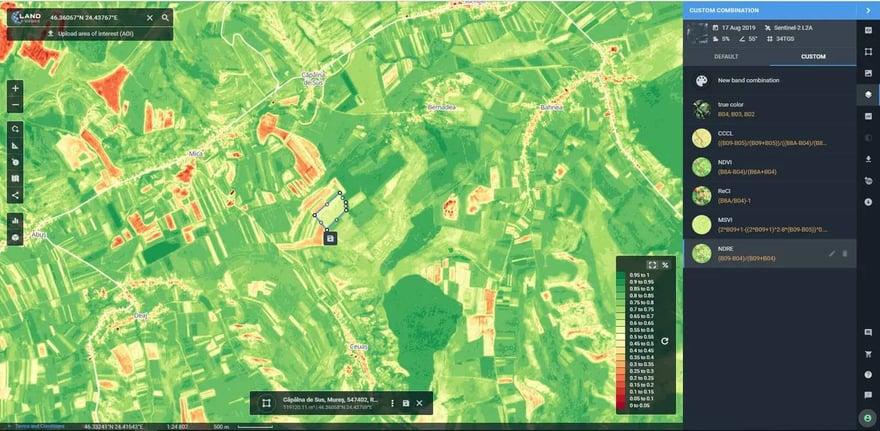
NDVI (Normalized Difference Vegetation Index)
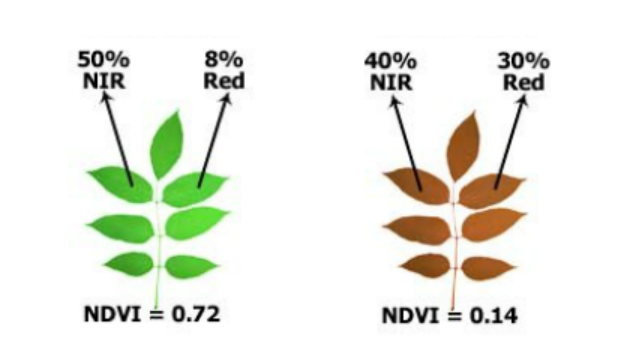
Normalized Difference Vegetation Index (NDVI) is the most common of the indices used in remote sensing. Chlorophyll, the green pigment indicative of plant health, exhibits strong absorption of visible light, while the cellular components of leaves reflect near-infrared light prominently. When a plant experiences stress like dehydration or disease, its cellular structure alters, resulting in increased absorption of near-infrared light. So, monitoring the changes in near-infrared light relative to red light is a reliable method for assessing the presence of chlorophyll, which directly correlates with the overall health status of the plant. A dip in NDVI is a cause for concern, indicating deterioration in crop health.
Source: MSU ECE Department
Formula
NDVI=NIR−RED/NIR+RED
This formula calculates vegetation density as the ratio of the difference between near-infrared (NIR) and red (RED) reflectance to their sum.
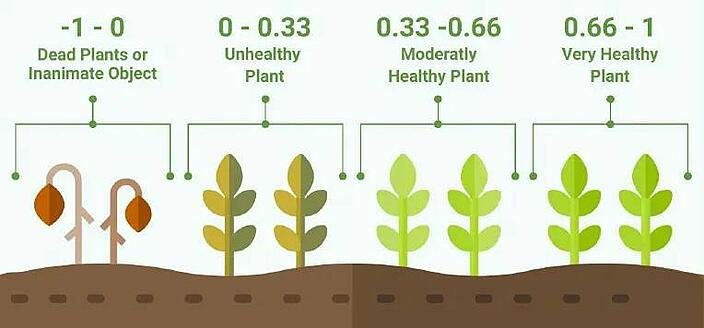
Index range: The NDVI value ranges from -1 to +1.
|
NDVI values |
Indication |
|
Negative values |
Clouds, water, snow |
|
Values close to zero |
Rocks and bare soil |
|
Very small values (0.1 or less) |
Empty areas of rocks, sand, snow |
|
Moderate values (0.2-0.3) |
Shrubs and meadows |
|
Higher values (0.6-0.8) |
Temperate and tropical forests |
Source: Phenospex
Applications: NDVI is typically used for crop health monitoring, driving precision agriculture, quantifying forests, and indicating drought. It is most accurate during the growth stage (middle of the season).
Limitations: The most popular limitation of NDVI is a phenomenon called "Saturation." When leaf pigmentation touches the critical point, “Saturation” is observed, usually during the maturity stage of crops.
Normalized Difference Red Edge Index (NDRE)
The normalized difference red edge index (NDRE) examines whether vegetation images obtained from multi-spectral image sensors show healthy crops. It replaces the RED reflectance of NDVI by the edge of Red and can be used only when a sensor provides data for this spectral band. NDRE is sensitive to chlorophyll content in leaves, variability in the leaf area, and soil background effects. NDVI is used to observe variations in amounts of chlorophyll through the foliage. This way, NDRE overcomes the limitation of NDVI, which measures chlorophyll in the upper canopy, particularly at the maturity stage, when NDVI may saturate.
Formula:
NDRE=NIR−RedEdge/NIR+RedEdge
Index Range: The standard scale of NDRE value ranges from -1 to +1.
|
NDRE values |
Indication |
|
-1 to 0.2 |
Bare soil or developing crop |
|
0.2 to 0.6 |
Unhealthy plant or crop not yet mature |
|
0.6 to 1 |
Healthy, mature, ripening crops |
Applications: The best time to use the NDRE index is during crop maturity and ripening. An NDRE value below 0.6 indicates deviation in a mature crop and calls for attention. It could be due to unhealthy plants, pest infestation, or nutrient deficiency. NDRE is a better indicator of crop health at this crop stage than NDVI.
Limitations: Low NDRE values can indicate both bare soil and young plants; hence, they cannot be used in the early stages of plant growth.
Source: EOS
VHI (Vegetation Health Index)
Here, the reading is determined using a combination of Land Temperature Surface (LST) and NDVI. This index, however, may not be ideal for non-arid regions. Instead, it is one of the best Vegetation indices used for analyzing drought.

Source: FAO
Soil-Adjusted Vegetation Index (SAVI)
The Soil-Adjusted Vegetation Index (SAVI) is a vegetation index devised to minimize the influence of soil brightness. It does this by using the soil-brightness correction factor.
Formula
SAVI is calculated as the normalized difference between the red and near-infrared (NIR) bands.
SAVI = ((NIR - Red) / (NIR + Red + L))*(1+L), where L is a soil brightness correction factor.
The value of L depends on the amount of green vegetation cover.
|
Value of L |
Amount of green vegetation cover |
|
1 |
No green vegetation cover |
|
0.5 |
Moderate vegetation cover |
|
0 |
High vegetation cover |
When L=0, SAVI and NDVI are identical.
Index Range: The range for SAVI is between 0 and 1
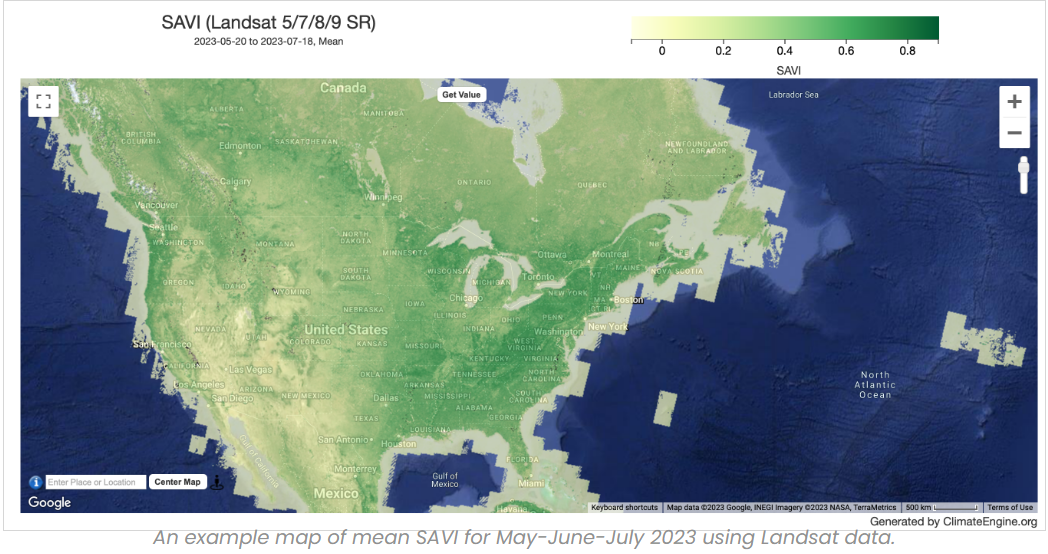
Source: Climate Engine.org
Applications: SAVI replaces NDVI in places where it cannot provide accurate values, such as for young crops and in arid regions having low vegetative cover.
Limitation: SAVI needs the L parameter. Estimating L accurately is quite difficult as all soils are not alike.
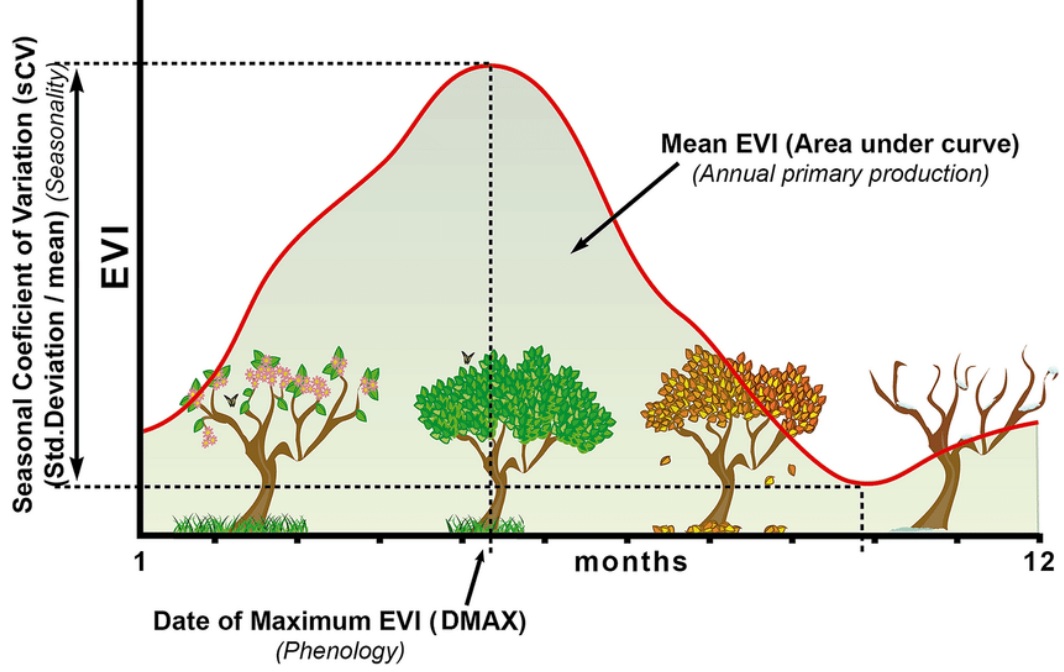
Enhanced Vegetation Index (EVI)
Enhanced Vegetation Index (EVI) is an advanced vegetation index conceived for precise vegetation monitoring. Considered a refined iteration of NDVI, EVI boasts enhanced sensitivity to biomass, atmospheric interference, and soil conditions.
EVI removes confounding factors such as cloud cover, smoke, aerosols, and water. It amplifies the vegetation signal while minimizing interference from canopy background and atmospheric influences, resulting in superior performance, especially in high biomass regions.
Index Range: EVI clearly indicates vegetation health. The values range from -1 to 1. If EVI is closer to 1, the vegetation is healthier, while values nearing 0 suggest compromised plant health.
Source: CAESCG, CC BY-SA 4.0, via Wikimedia Commons
Applications: EVI offers insights into the health and dynamics of plant life across diverse landscapes. Its responsiveness to factors like leaf area index (LAI), canopy type, and architecture makes it a versatile tool for understanding ecosystem dynamics. Moreover, EVI's performance remains robust even in challenging conditions, like the presence of snow, where it demonstrates an increase while NDVI decreases.
Its enhanced sensitivity improves understanding of subtle changes in vegetation patterns and derives biophysical parameters more accurately. NDVI and EVI are complementary for global vegetation studies, better vegetation change detection, and canopy biophysical characteristics.
EVI has proven invaluable for detecting vegetation change and the characterization of canopy properties in specific regions. For instance, EVI revealed previously unnoticed growth patterns in the Amazon rainforest, particularly during the dry season. This discovery has profound implications for understanding the carbon cycle of this forest.
Limitations: Anomalies like cloud cover or water bodies can affect EVI readings, necessitating careful interpretation in such scenarios.
Leaf Area Index (LAI)
The Leaf Area Index (LAI), defined as the projected leaf area per unit of ground surface area (m²/m²), is a fundamental metric for understanding plant canopies. Its study delves into the intricate dynamics of foliage distribution within ecosystems.
To calculate LAI, a representative statistically significant foliage sample is collected from a plant canopy. The leaf area of this sample plot is then measured, and the result is divided by the plot's surface area.
Index Range: LAI generally ranges from 0 to 10. Zero indicates bare ground, while 10 represents dense conifer forests.
Application: As LAI measures the total area of leaves per unit area of the plot, it directly correlates to the amount of light the crop receives. Hence, LAI finds applications in understanding photosynthetic primary production, respiration, and evapotranspiration. It is indispensable in assessing ecosystem health and functionality.
Land Surface Water Index (LSWI)
The Land Surface Water Index (LSWI) uses near-infrared (NIR) and the shortwave infrared (SWIR) regions of the spectrum. Liquid water strongly absorbs light in the SWIR region, making LSWI sensitive to the overall liquid water content of the vegetation and its underlying soil. The NIR region, unaffected by water content fluctuations, is a stable reference point for comparison. Calculated as a normalized ratio between NIR and SWIR, LSWI serves as a valuable metric for assessing vegetation and soil water content.
Index Range: The values of this index range from -1 to +1. The common range for green vegetation is 0.2-0.6.
Applications: LSWI finds diverse applications, including monitoring crop irrigation, productivity forecasting, fire hazard assessment, and ecosystem physiology studies. Notably, this index operates inversely compared to other vegetation water indices. Higher LSWI values indicate heightened water stress and diminished water content.
Limitations: A rice field submerged in water and a healthy crop field both exhibit high LSWI values.
NDWI (Normalized Difference Water Index)
The Normalized Difference Water Index (NDWI) helps relate to the water content in plants, making it a good indicator of plant water stress. NDWI is the normalized difference between visible green (high reflectance of water surface) and near-infrared (high reflectance of soil and terrestrial vegetation) spectral bands. It can detect and monitor even marginal changes in the water content of the water bodies.
Index Range: The NDWI values range between -1 to +1. For water bodies, NDVI is positive, typically above 0.5, while it is negative to zero for soil and terrestrial vegetation, making it easy to differentiate the two.
Application: NDWI effectively identifies water bodies and monitors water turbidity. Particularly valuable in regions affected by drought, NDWI finds applications in agricultural monitoring, crop irrigation, fire risk assessment, and pasture management. Its relevance to climate change is significant, making it indispensable in understanding and mitigating its impact.

NDWI of Canadian lakes acquired on 5/08/2020
Source: Sentinel Hub
Limitation: NDWI is sensitive to built structures, resulting in over-estimation of water bodies.
Tillage Metric (sustainability)
High-residue cover cropping is a conservation tillage practice. Here, a high-biomass cover crop is cultivated during the winter months. This cover crop is subsequently rolled or cut down before the onset of spring, facilitating no-till or strip-till planting. It yields many benefits, including enhanced soil quality, reduced erosion, and minimized leaching of agrochemicals. No-tillage enhances soil organic matter and promotes improved water infiltration, fostering sustainable agricultural practices.
Satellite-based remote sensing techniques offer invaluable insights into crop residue cover and tillage assessment. Cropin has developed a customized Tillage metric from the spectral bands.
Index Range: The values range between -1 to +1
Applications: This index quantifies soil preparation activities before sowing by using the Short Wave Infrared (SWIR) satellite bands.
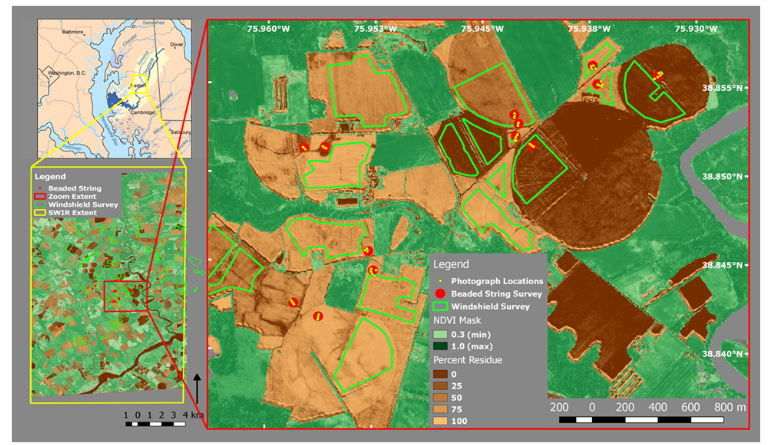
Springtime map of the agricultural landscape based on WorldView-3 satellite imagery: shades of tan depict varying amounts of crop residue from bare soils to 100% cover.
Source: USGS
ChlRe – Chlorophyl Red Edge (for greenness - nitrogen)
ChlRe leverages the unique properties of a narrow spectral band positioned between the red and near-infrared (NIR) regions within the plant reflectance spectrum. This specialized band forms the basis for calculating the chlorophyll red-edge index.
Application: For variable rate applications, the precision of ChlRe is significantly higher than NDVI. Some applications of ChlRe in agriculture are:
-
Diverse precision agriculture uses
-
Identification of nutrient deficiencies in plants
-
Nitrogen fertilizer uptake assessment
-
Yield prediction
-
Variable rate application prescription mapping
Source: African Agriculture GeoPortal
NBR (Normalized Burn Ratio)
This Vegetation index is used to identify the burn severity in large fire zones with remote access. Traditionally, this value is derived using NIR and SWIR values observed from Landsat. At Cropin, we use the index to detect forest fires and stubble burning, an annual event in northern India.
Formula
NBR= (NIR – SWIR) / (NIR + SWIR)
Rapid technological advancements are transforming agriculture, enhancing yield per acre through precision practices. Utilizing indices is crucial for precision agriculture. By harnessing these indices and cutting-edge technology, we can reduce the pressure on land over time and achieve sustainable agriculture goals.
The Cropin Cloud platform utilizes vegetation indices data from satellite imagery. It overlays these onto its contextual deep AI/ML models to assess crop health, crop stage, nutrient requirements, and irrigation schedules.
This article was updated in July 2024 for comprehensiveness and edits.
